
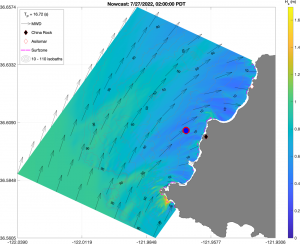
ROXSI nowcast 20-m grid example wave height (color) and direction (arrows). Location of nearshore wave buoy measurement is the red outlined blue dot.
As we wrap up the field program for ROXSI 1, I wanted to revisit the nowcast model performance compared to one of the nearshore wave observations (Quick side note: instrument recovery was a spectacular effort from land and sea by everyone involved!). A reminder, the ROXSI nowcast takes bulk wave spectral characteristics from a real-time offshore NDBC buoy (40 km offshore, in 1700 m of water) every 4 hours and uses this information as boundary conditions on 3 nested SWAN grids run in parallel. The nowcast simulates wave conditions around the rocky nearshore experimental focus region, including a nearshore wave buoy (< 1 km offshore, in 15 m of water) marked on the map.

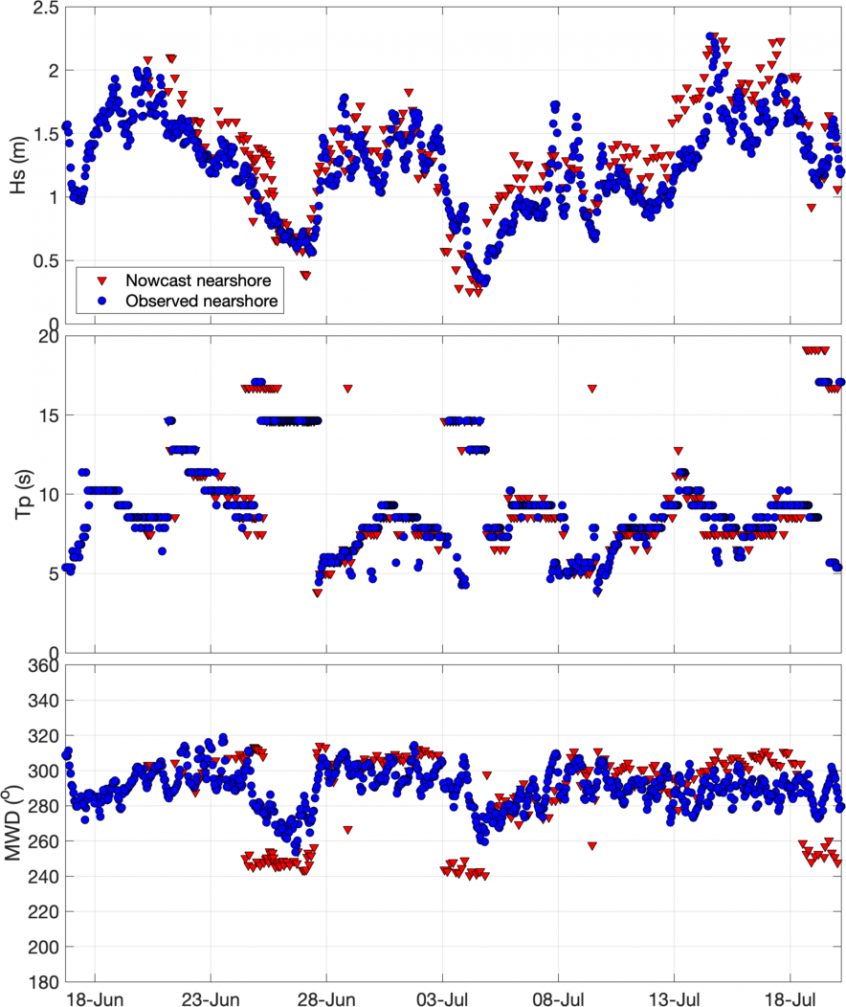
Offshore NDBC real-time wave observations (yellow) and ROXSI nearshore wave observations (blue)
Before looking at model results, first let’s compare the real-time offshore NDBC forcing conditions with the observed nearshore waves. Here, there is decent correspondence between wave measurements taken far offshore (yellow) and those in the nearshore (blue). This is because China Rock is such an exposed part of the Monterey Peninsula coastline, especially to waves coming from the north-west (MWD ~ 300o). Notice however, significant wave height (Hs) does tend to be larger offshore and there are several periods of offshore south-west swell (MWD ~ 200o) that are ~60o different from the nearshore measurements.

ROXSI nowcast nearshore wave model output (red) and ROXSI nearshore wave observations (blue)
Wave conditions are now simulated with the ROXSI nowcast such that wave energy is propagated through our 3 SWAN domains. Model results are extracted from the same location as the nearshore buoy and compared here. Simulated Hs from the same modeled location (red) well matches the observations (blue). The large MWD directional discrepancy seen in the previous figure is now significantly reduced for the south-west swell periods.
These results are encouraging as they indicate that SWAN-simulated bulk refraction and processes controlling wave attenuation appear reasonable for our setting. However, it can still be improved. At this point, we have not simulated any wind or ocean current effects and default SWAN friction and breaking parameters are still used. These comparisons are also of “bulk” wave field characteristics that integrate over many wave frequencies, a process that can smooth over errors and inconsistencies. As preliminary real-time data turn into processed full frequency-directional wave spectra, we are excited to see how our model adjustments can result in better wave predictions.