

Over the past two weeks the SIO group has also been doing UAS flights with lidar but at China Rock. See Matt’s post from July 16th at Asilomar. Similar to the Oregon State group, our strategy has been principally to hover in space for ~12 minutes usually over an instrument – see the China Rock instrument map below.
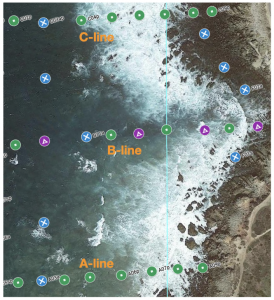
An example movie of the lidar data from a C-line instrument is shown below. The instrument is C05 which is the 5th green circle counting from onshore on the C-line at the top of the figure.
There are 4 panels in the movie. The top-left shows the water elevation (z – in meters) as a function of the China Rock (x,y) coordinate system. A new frame is shown every 0.2 s. The magenta diamond shows the location of the drone. The top-right shows the lidar beam numbers and is not particularly interesting, except that one particular beam is highlighted in red. The data from that beam is shown in the bottom-left panel in a (x,z) coordinate system. This allows one to see the waves propagating and reflecting. The bottom right panel shows data from all 32 beams with the the y-location colored.
Overall, this data is very promising as all kind of wave processes, steepening, breaking, reflection are visible. We now need to synchronize this to the visible images and put everything into the china rock coordinate system.